
Whether you are a reporter, a real estate agent, or just someone who loves facts and figures, you’ll love our real estate statistics.
We’ve compiled our favorites, ranging from average home prices to typical buyer demographics.
Why Real Estate Statistics?
Why real estate statistics? Our goal is to bring you the best market insights. So it’s only natural that we present cold, hard figures. Read on to see our favorite real estate statistics.
1. Median Home Prices
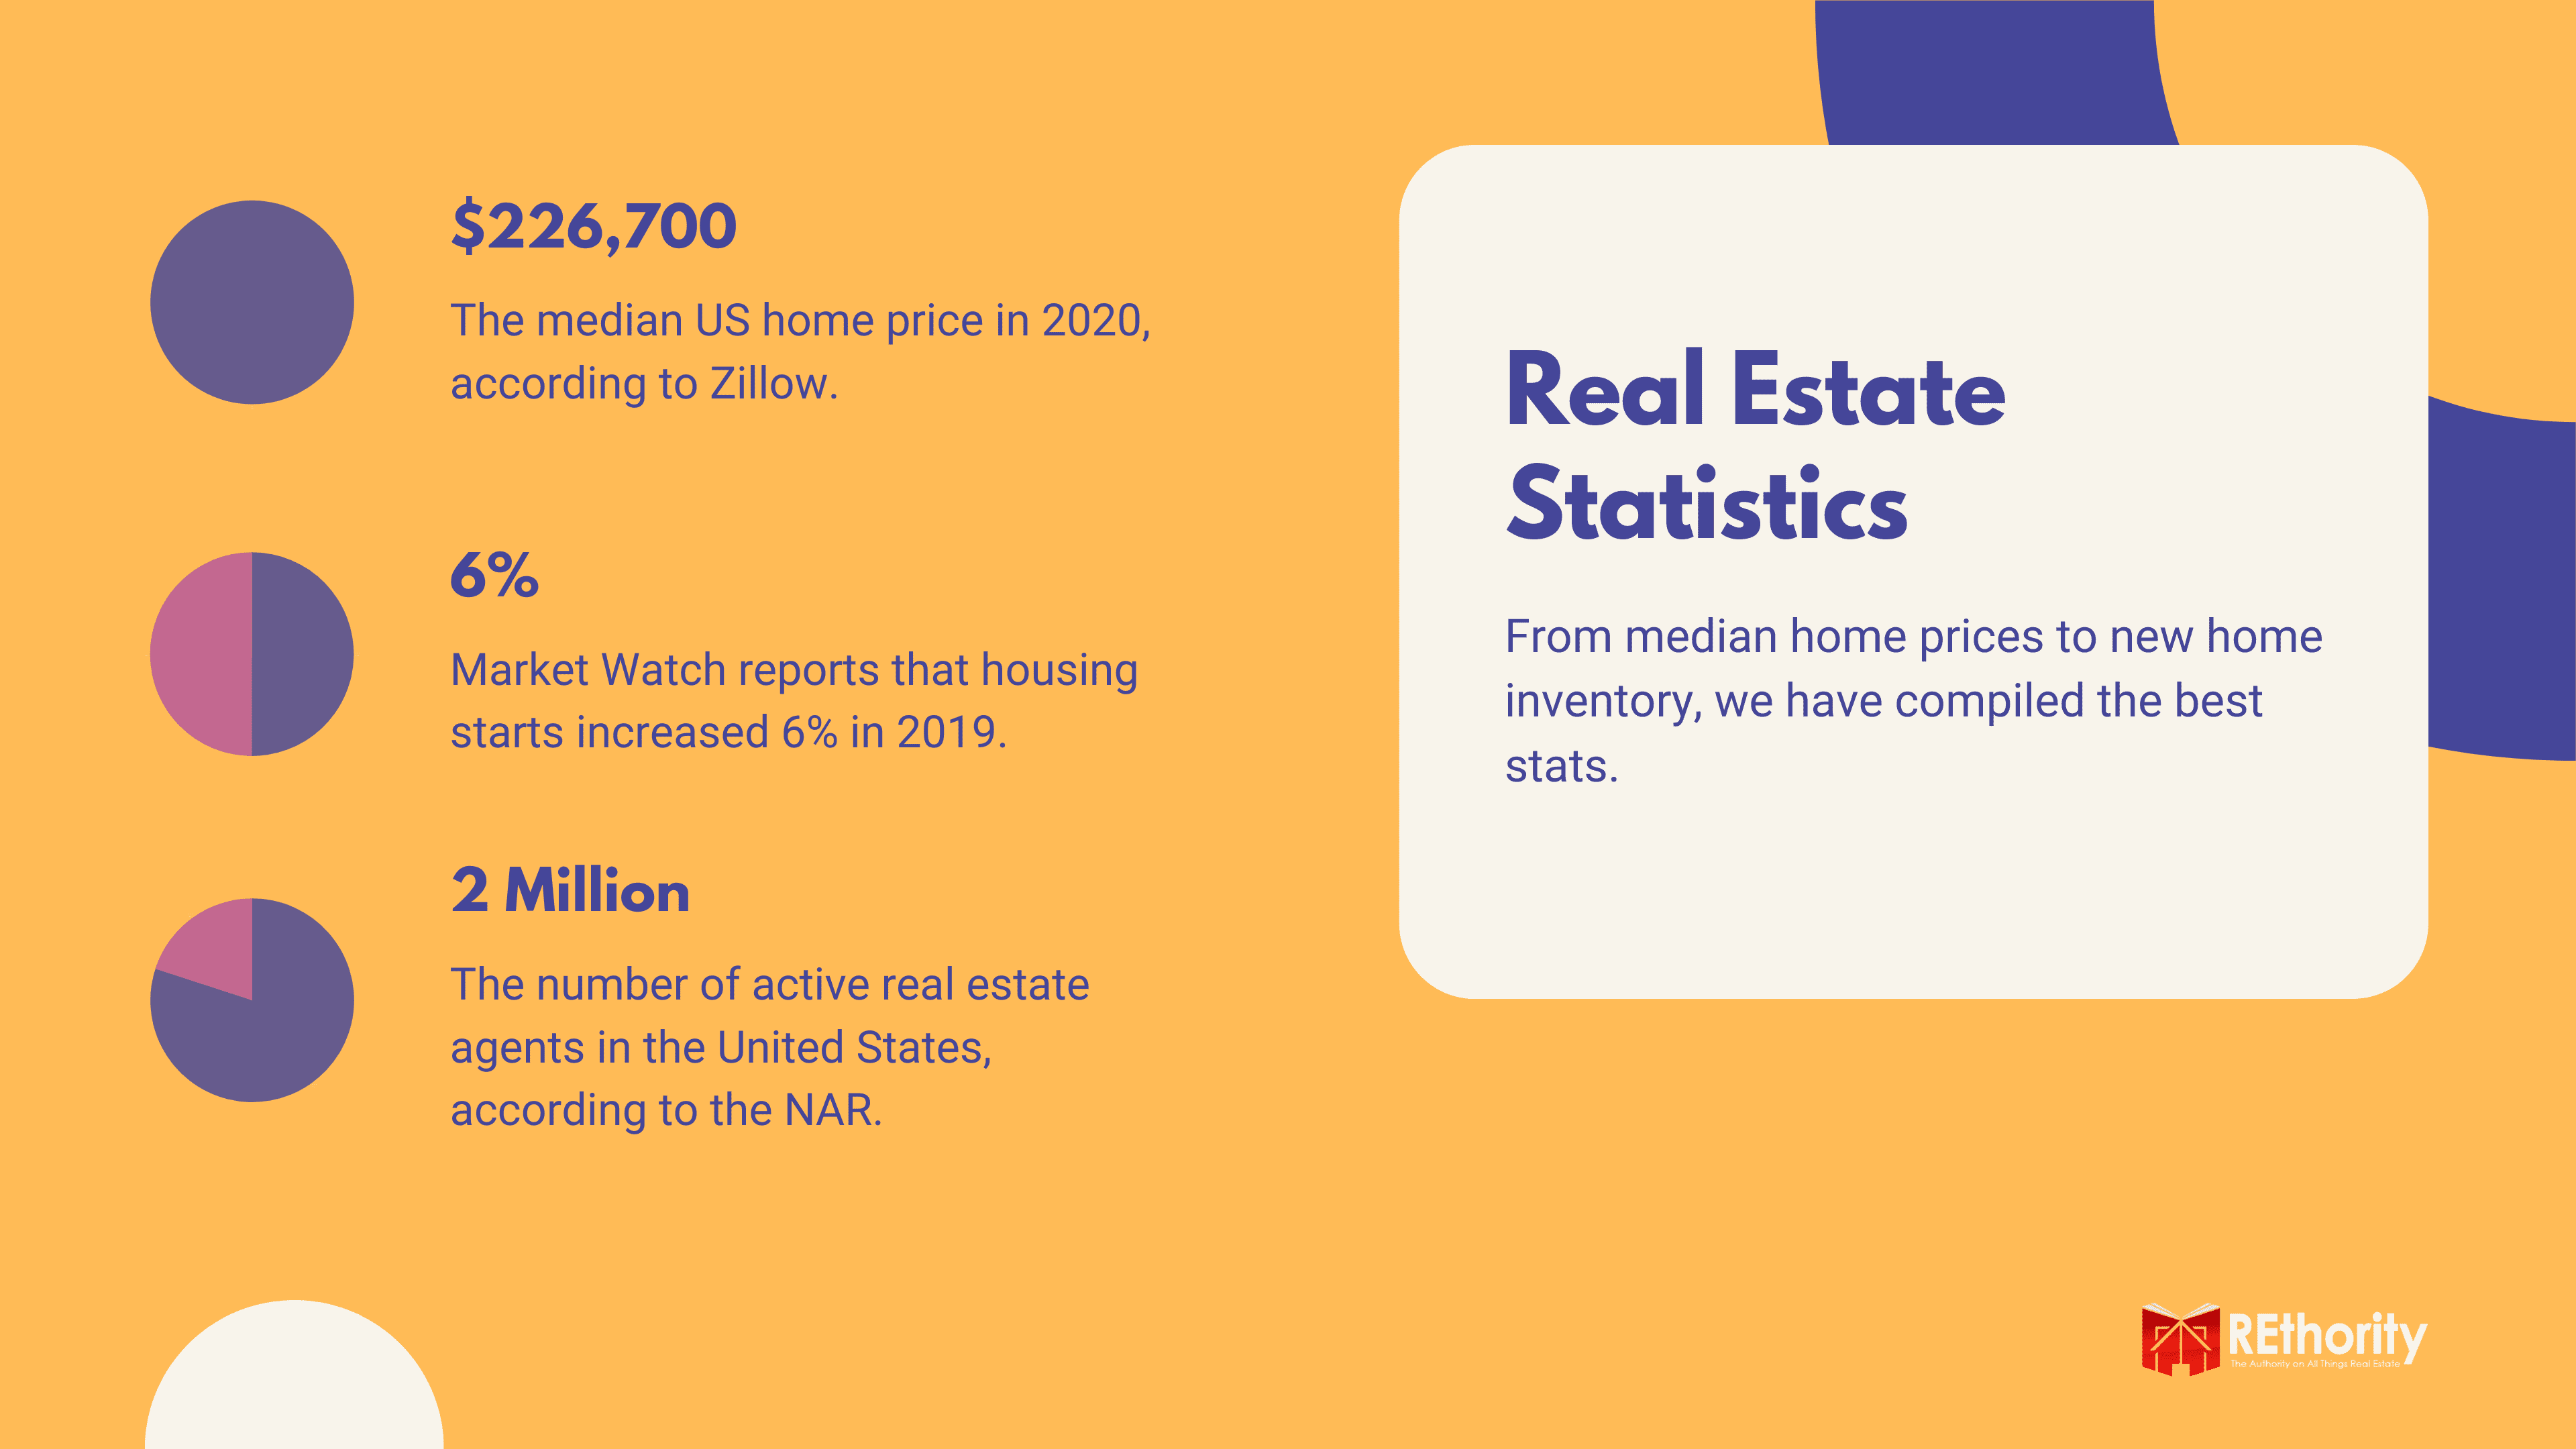
Since 2016, real estate markets have been on fire. Demand finally caught up with supply to ignite bidding wars in lower-priced homes. In 2020, this trend will slow. Zillow reports a median U.S. home price of $226,700.
According to Yahoo Finance, this is especially true in once-hot markets such as those on the West Coast. Inman.com agrees that while demand is cooling, prices are still up 7% since 2018.
This will pose a challenge for new buyers. In fact, they peg the average home price at $300,000, which we believe is more accurate than Zillow’s figure.

2. New Home Inventory
Although housing inventory is low, millennials will reach the prime buying age over the next decade. This will create demand for builders of affordably priced homes.
By some accounts, this has already begun happening. Market Watch reports that housing starts increased by 6% in 2019, but construction is slower this year than in 2018.
3. Total Homes Vs Total Agents
The National Association of Realtors reported that there are roughly 2 million active Realtors in the United States. Compared to the 5.34 million homes sold in 2018, the ratio is just over 2 homes for every agent.
While this number is extremely low, it is improving. Statista estimates there will be 5.5 million housing units for sale in 2019.
4. Average Household Income by Region
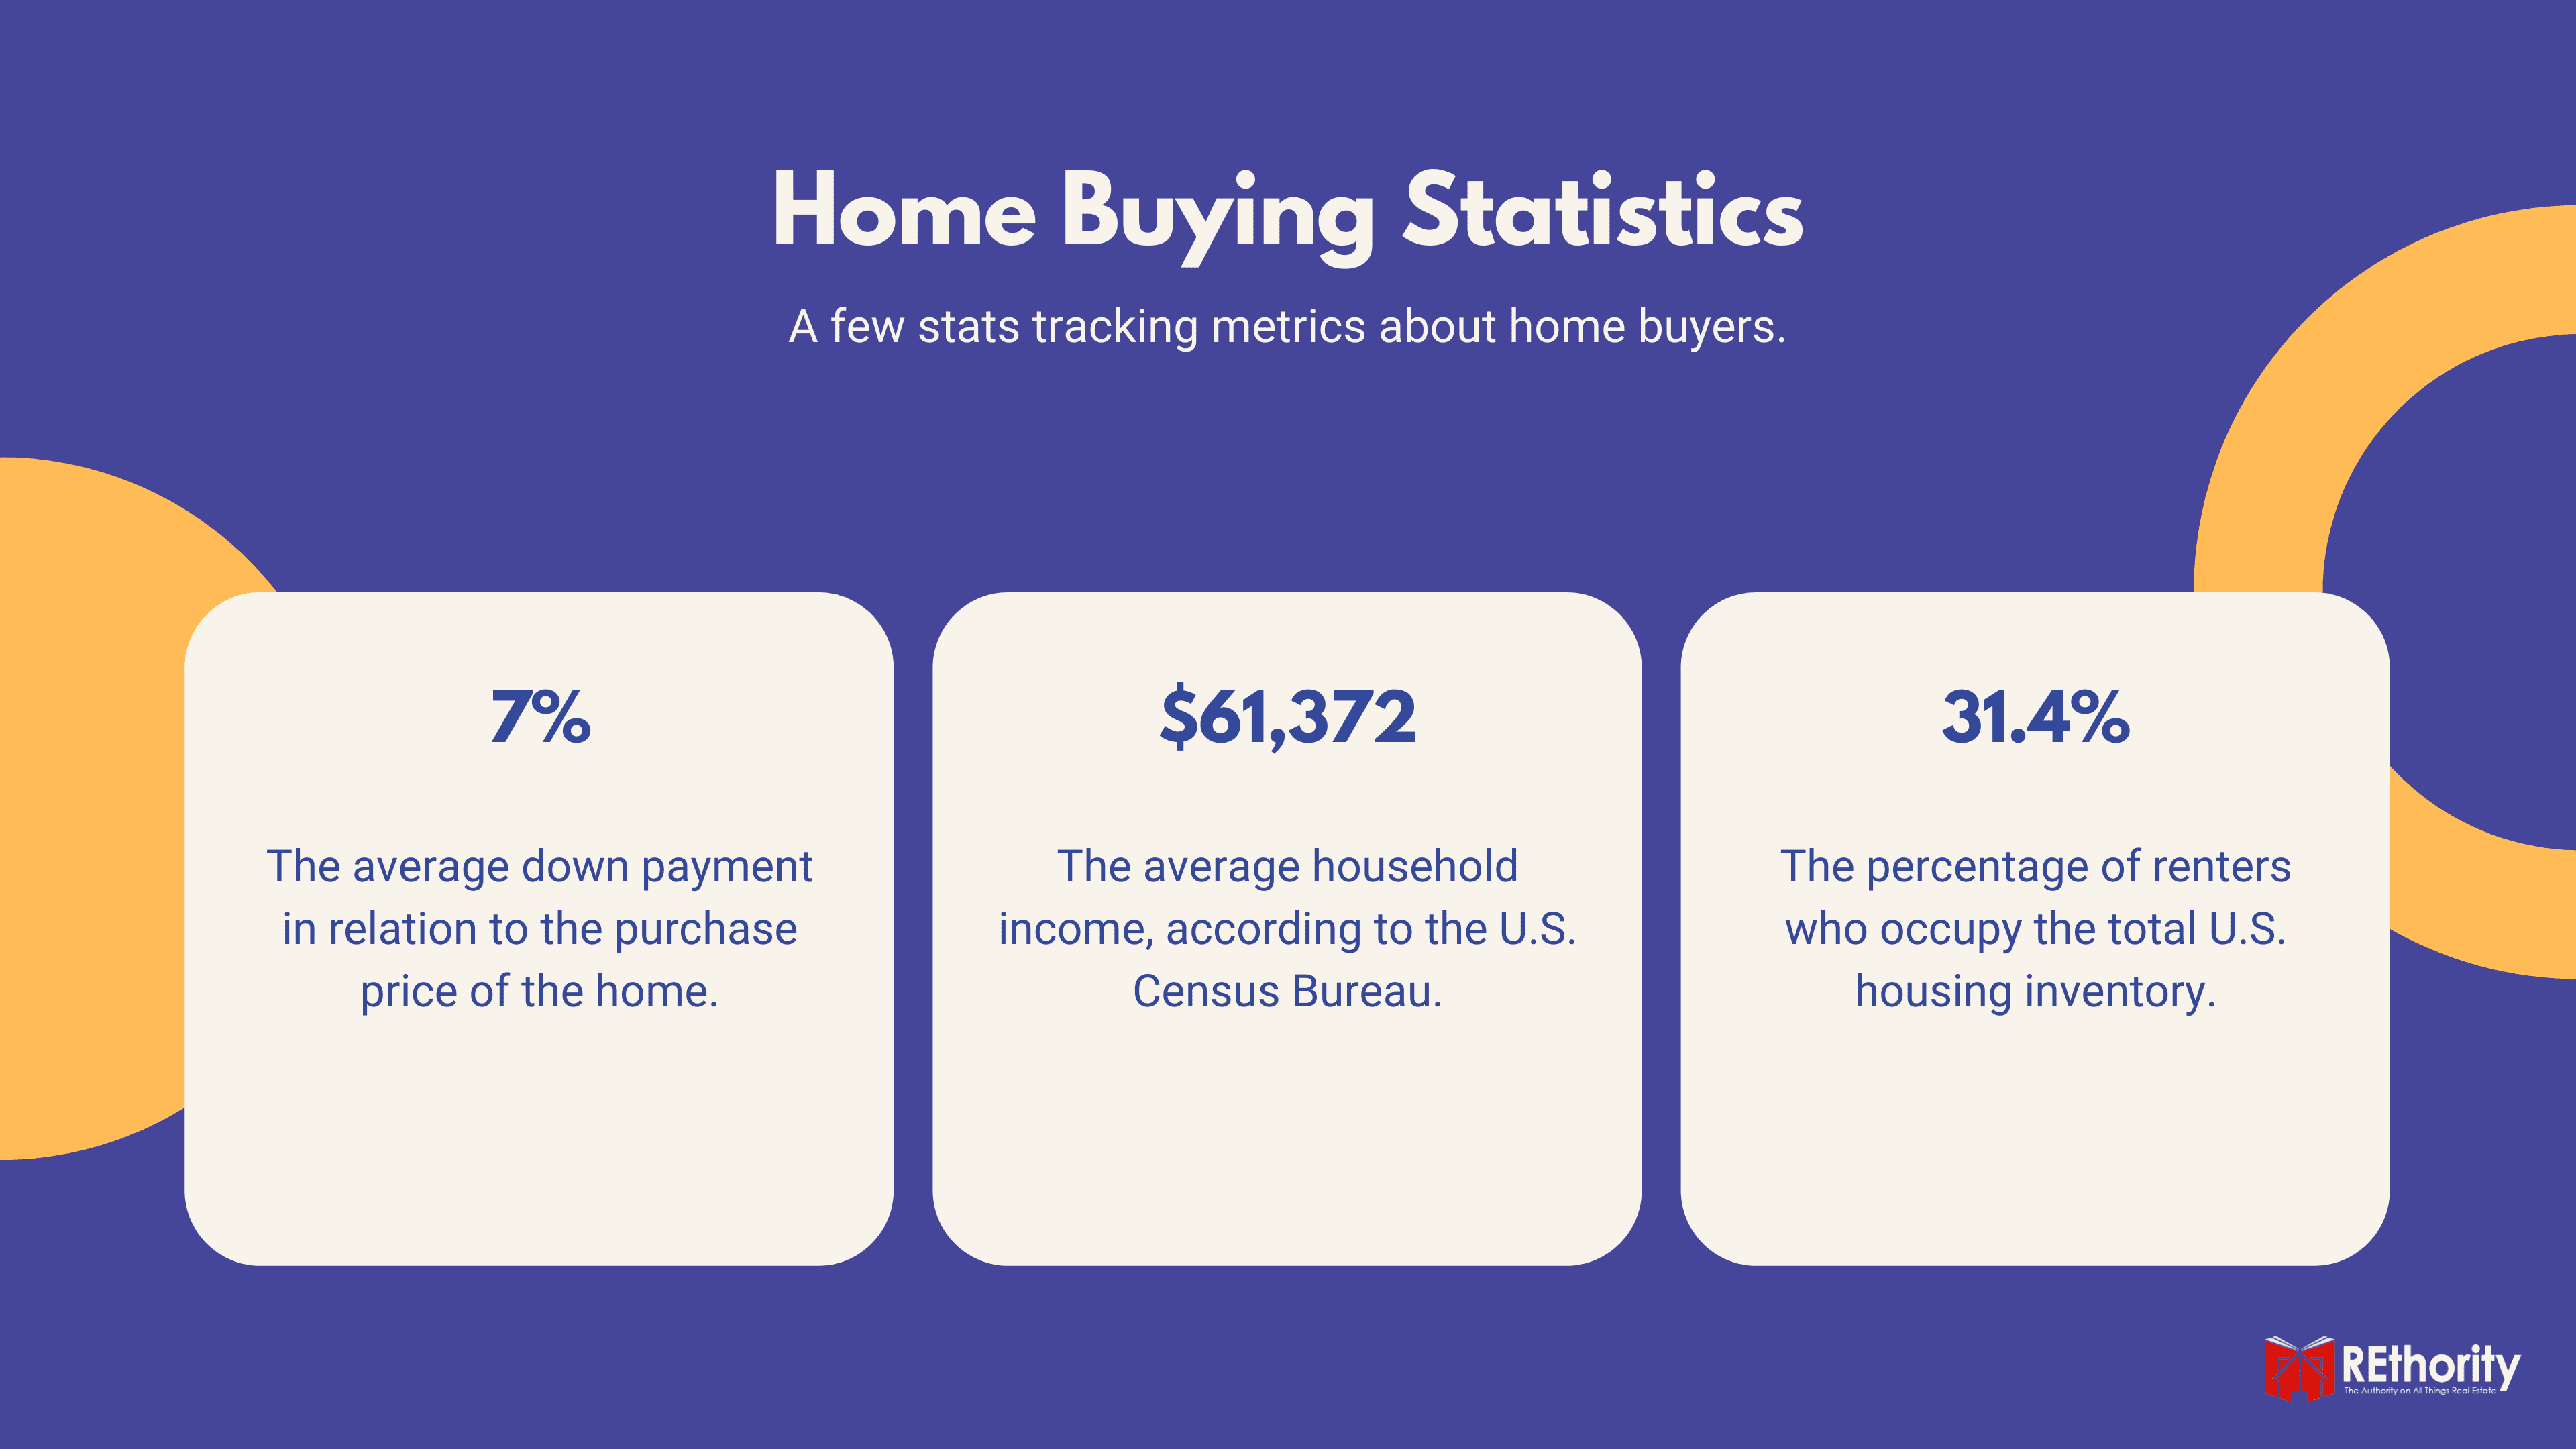
While housing prices are steadily increasing, incomes are not. According to the U.S. Census Bureau, the median household income is $61,372. This number is a slight improvement from the year before.
But it’s still barely enough to pay a mortgage. According to HSH.com, the household income needed to buy a home averages $61,000. By this metric, most homeowners are barely scraping by.

5. Average Down Payment
The average home buyer puts 7% down on their home. Based on NAR’s average home price of $300,000, this equals roughly $21,000. With a household income of $61,000, saving a down payment this large would be difficult.
6. Renters Are Waiting To Buy
Based on #5, it’s no wonder renters are waiting to buy a home. According to a 2019 Census study, renters occupy 31.4% of housing inventory.
With strong rental demand, it’s no surprise that the average asking price of vacant rental units increased from $800 in 2016 to $1,000 today.
7. Average Home Buyer Age
With high student debt loads and high housing prices, buyers are waiting longer to buy. While many Generation Xers want to buy homes by 30, it’s just not financially viable.
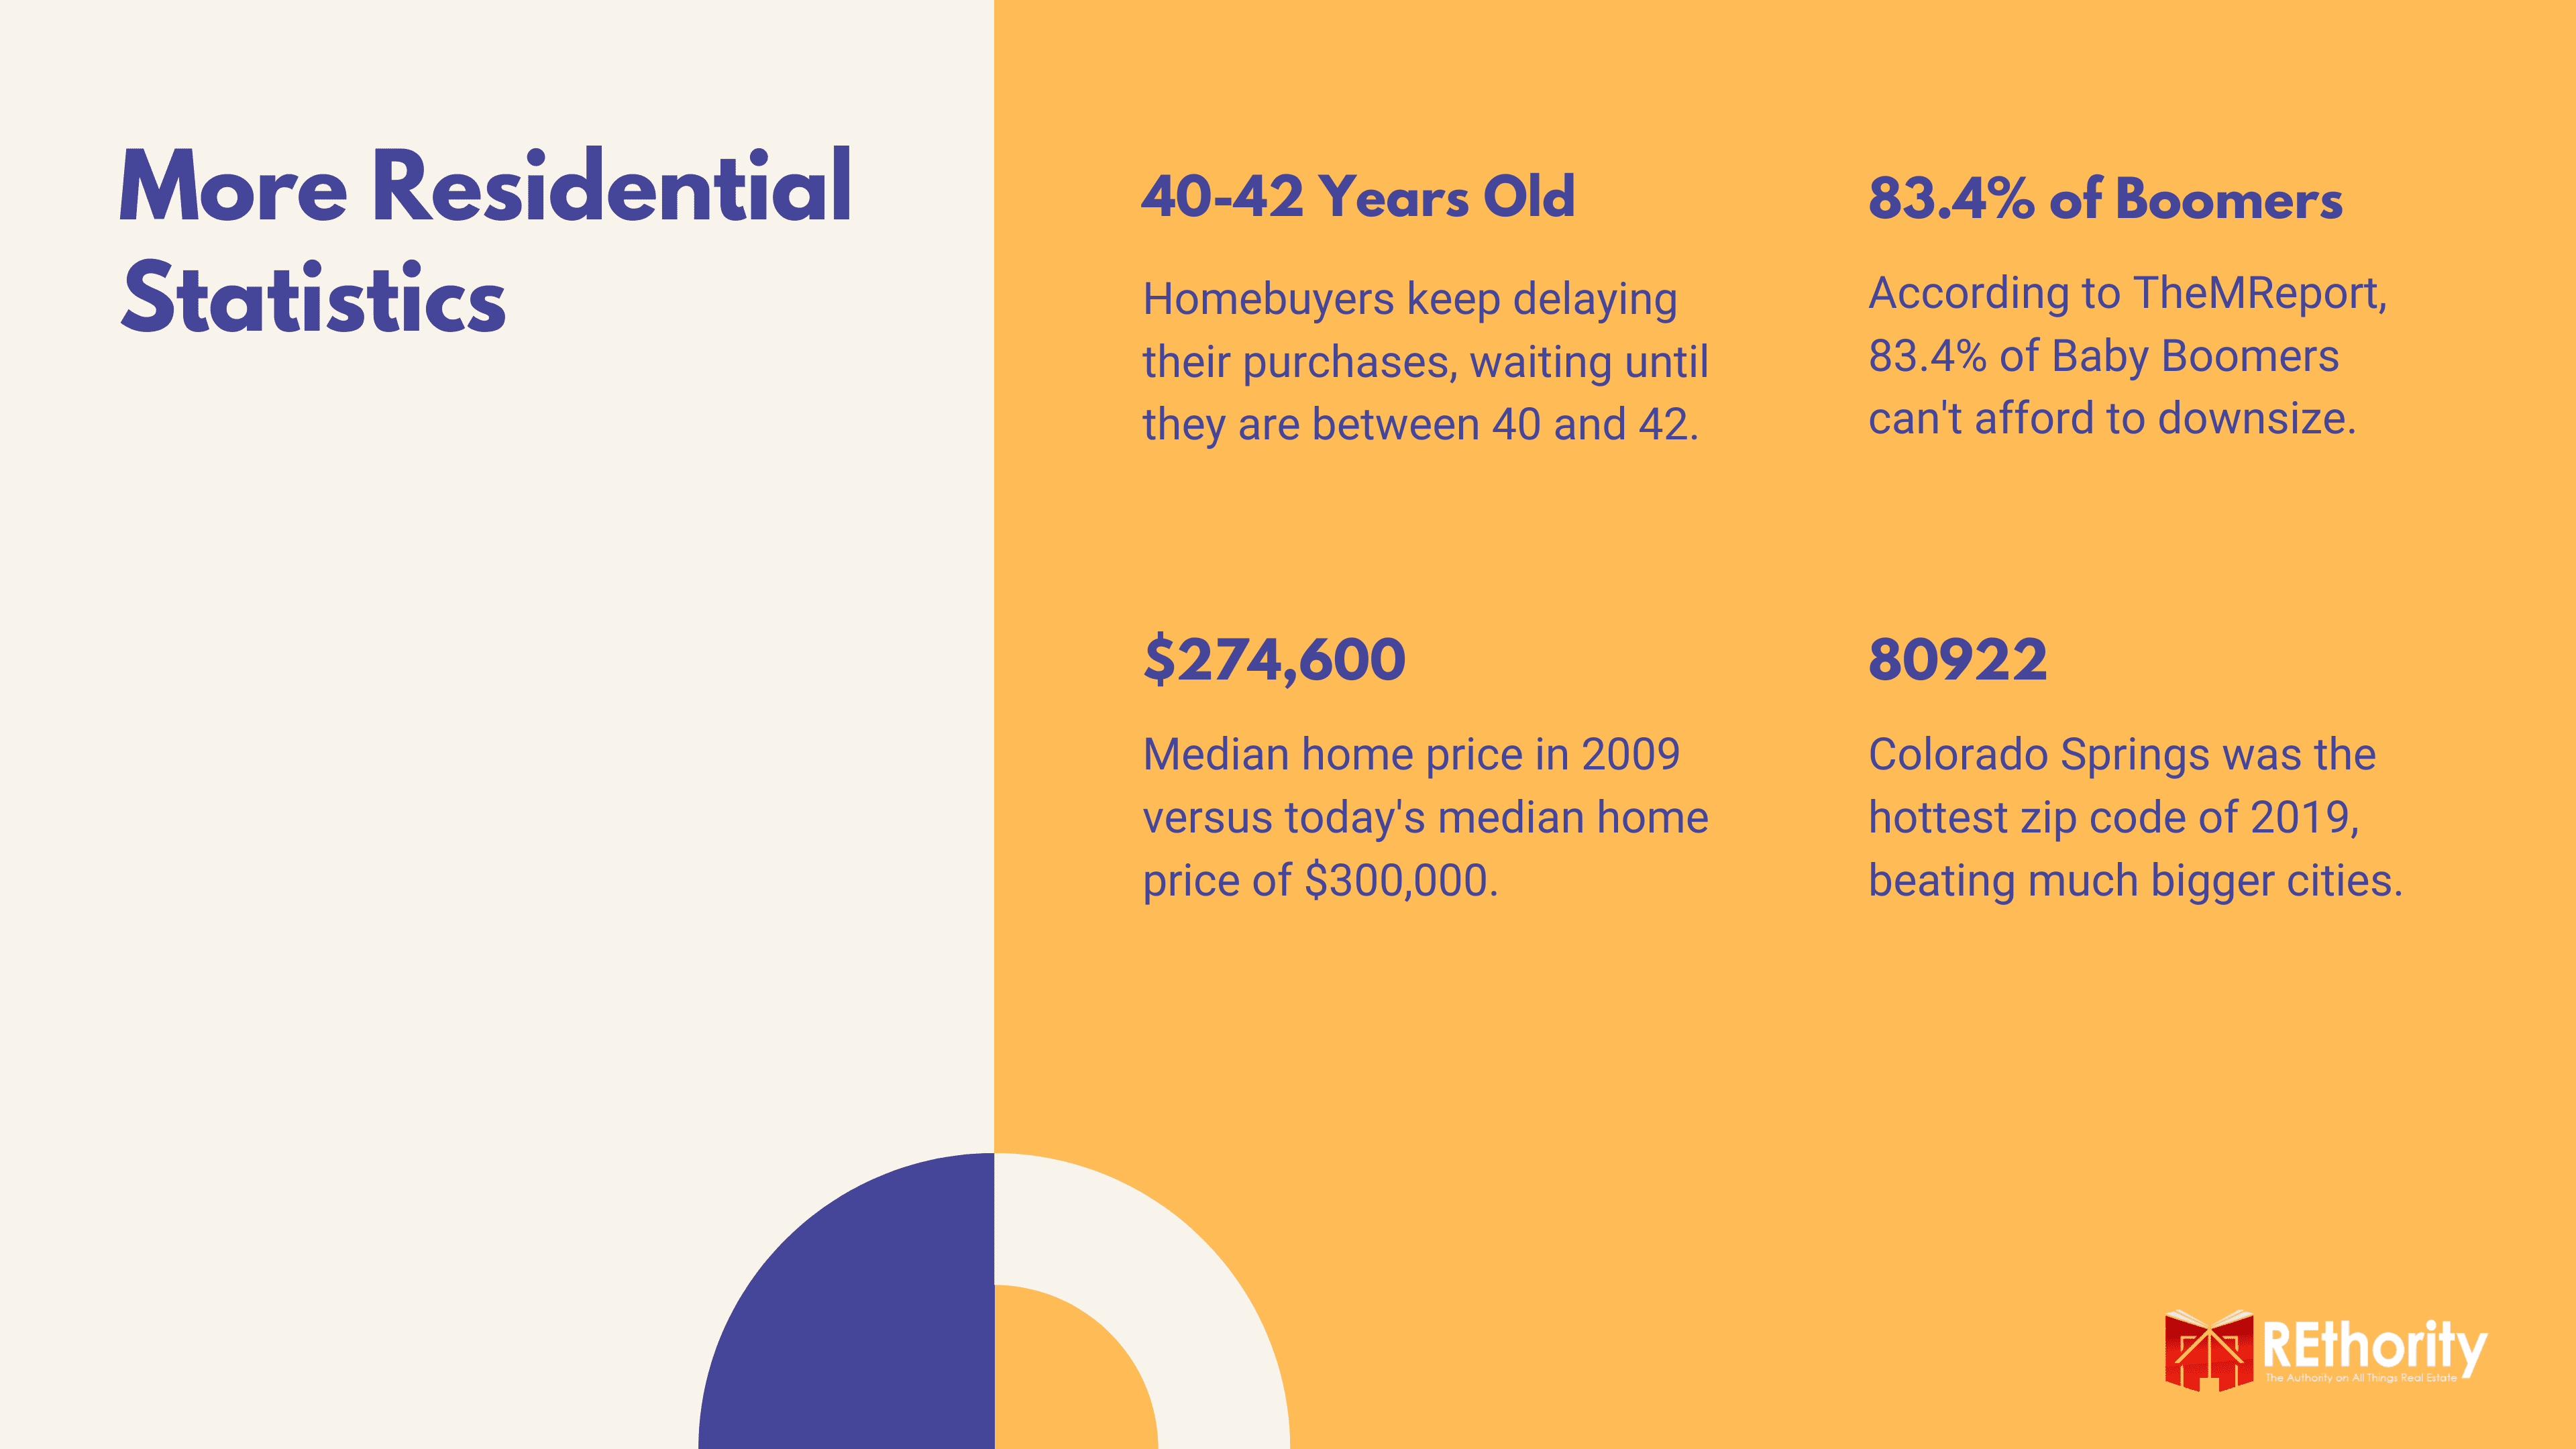
The average homebuying age continues to get older and now ranges between 40 and 42. Interestingly, buyers fall into the following demographics:
- Married: 63%
- Single Females: 18%
- Single Males: 9%
- Unmarried Couples: 8%
Additionally, 25% of millennials buy a home together before getting married, and 33% of all homebuyers are buying their first home.
And the median age of a first-time homebuyer is 32. Keep in mind that the average home buying age is different than the average first-time home buying age.

8. Where Are Boomers in Today’s Market?
According to TheMReport, 83.4% of baby boomers live in their houses alone. Many boomers are staying put because they are still working and can’t afford to downsize.
In fact, the percentage of seniors still working increased from 15.9 to 19.3 between 2003 and 2016. That’s an alarming statistic, considering most aim to retire by then.
9. Home Prices Now vs. 10 years Ago
A The Washington Post report found that if you compare 2008—the start of the National Recession and the collapse of the U.S. housing market—to today, home prices that had plummeted have since rebounded considerably.
According to the U.S. Census, the median home price in May 2009 was $274,600, just below Realtor’s 2019 average home price estimate. While these numbers are not apples to apples, they demonstrate how tighter lending standards have kept prices reasonable almost a decade later.
10. Days On Market
Although prices are still increasing, Bloomberg sees “softening demand” for homes leading to an increase in the number of days on market. Median times rose by 4 days in February 2018.
Buffalo News confirms the above data by concluding that people are staying in their homes much longer, so fewer and fewer homes are being listed for sale.
As a result, prices are high and sales are slow because they are out of reach for many Millennial buyers. Despite low inventory and rising prices, sales are still up. Homes may be staying on the market longer, but there are still buyers out there.
11. Hottest Zip Codes
With big cities getting bigger, the hottest zip codes are not in the cities themselves but in the suburbs. Millennials are specifically moving to more affordable and smaller suburban communities in favor of big cities like Denver or Austin.
In fact, Colorado Springs (80922) was very high on the list of the hottest zip codes. Interestingly, the most popular zip codes for house flippers included Memphis and Miami.

12. Buyer Social Media Usage
In the digital age, buyers are increasingly turning to social media as a lead generation tool. A recent agent survey conducted by Real Estate Express found 54% of agents need help with social media account management.
This was their number-one marketing challenge. Social media also impacts sellers in an unexpected way. ABC News reports that social media is effective for home owners wishing to list their home privately.
Forbes confirms this trend, citing NAR data that concludes 44% of buyers conduct online searches before starting their home search.
13. Online Real Estate Searches
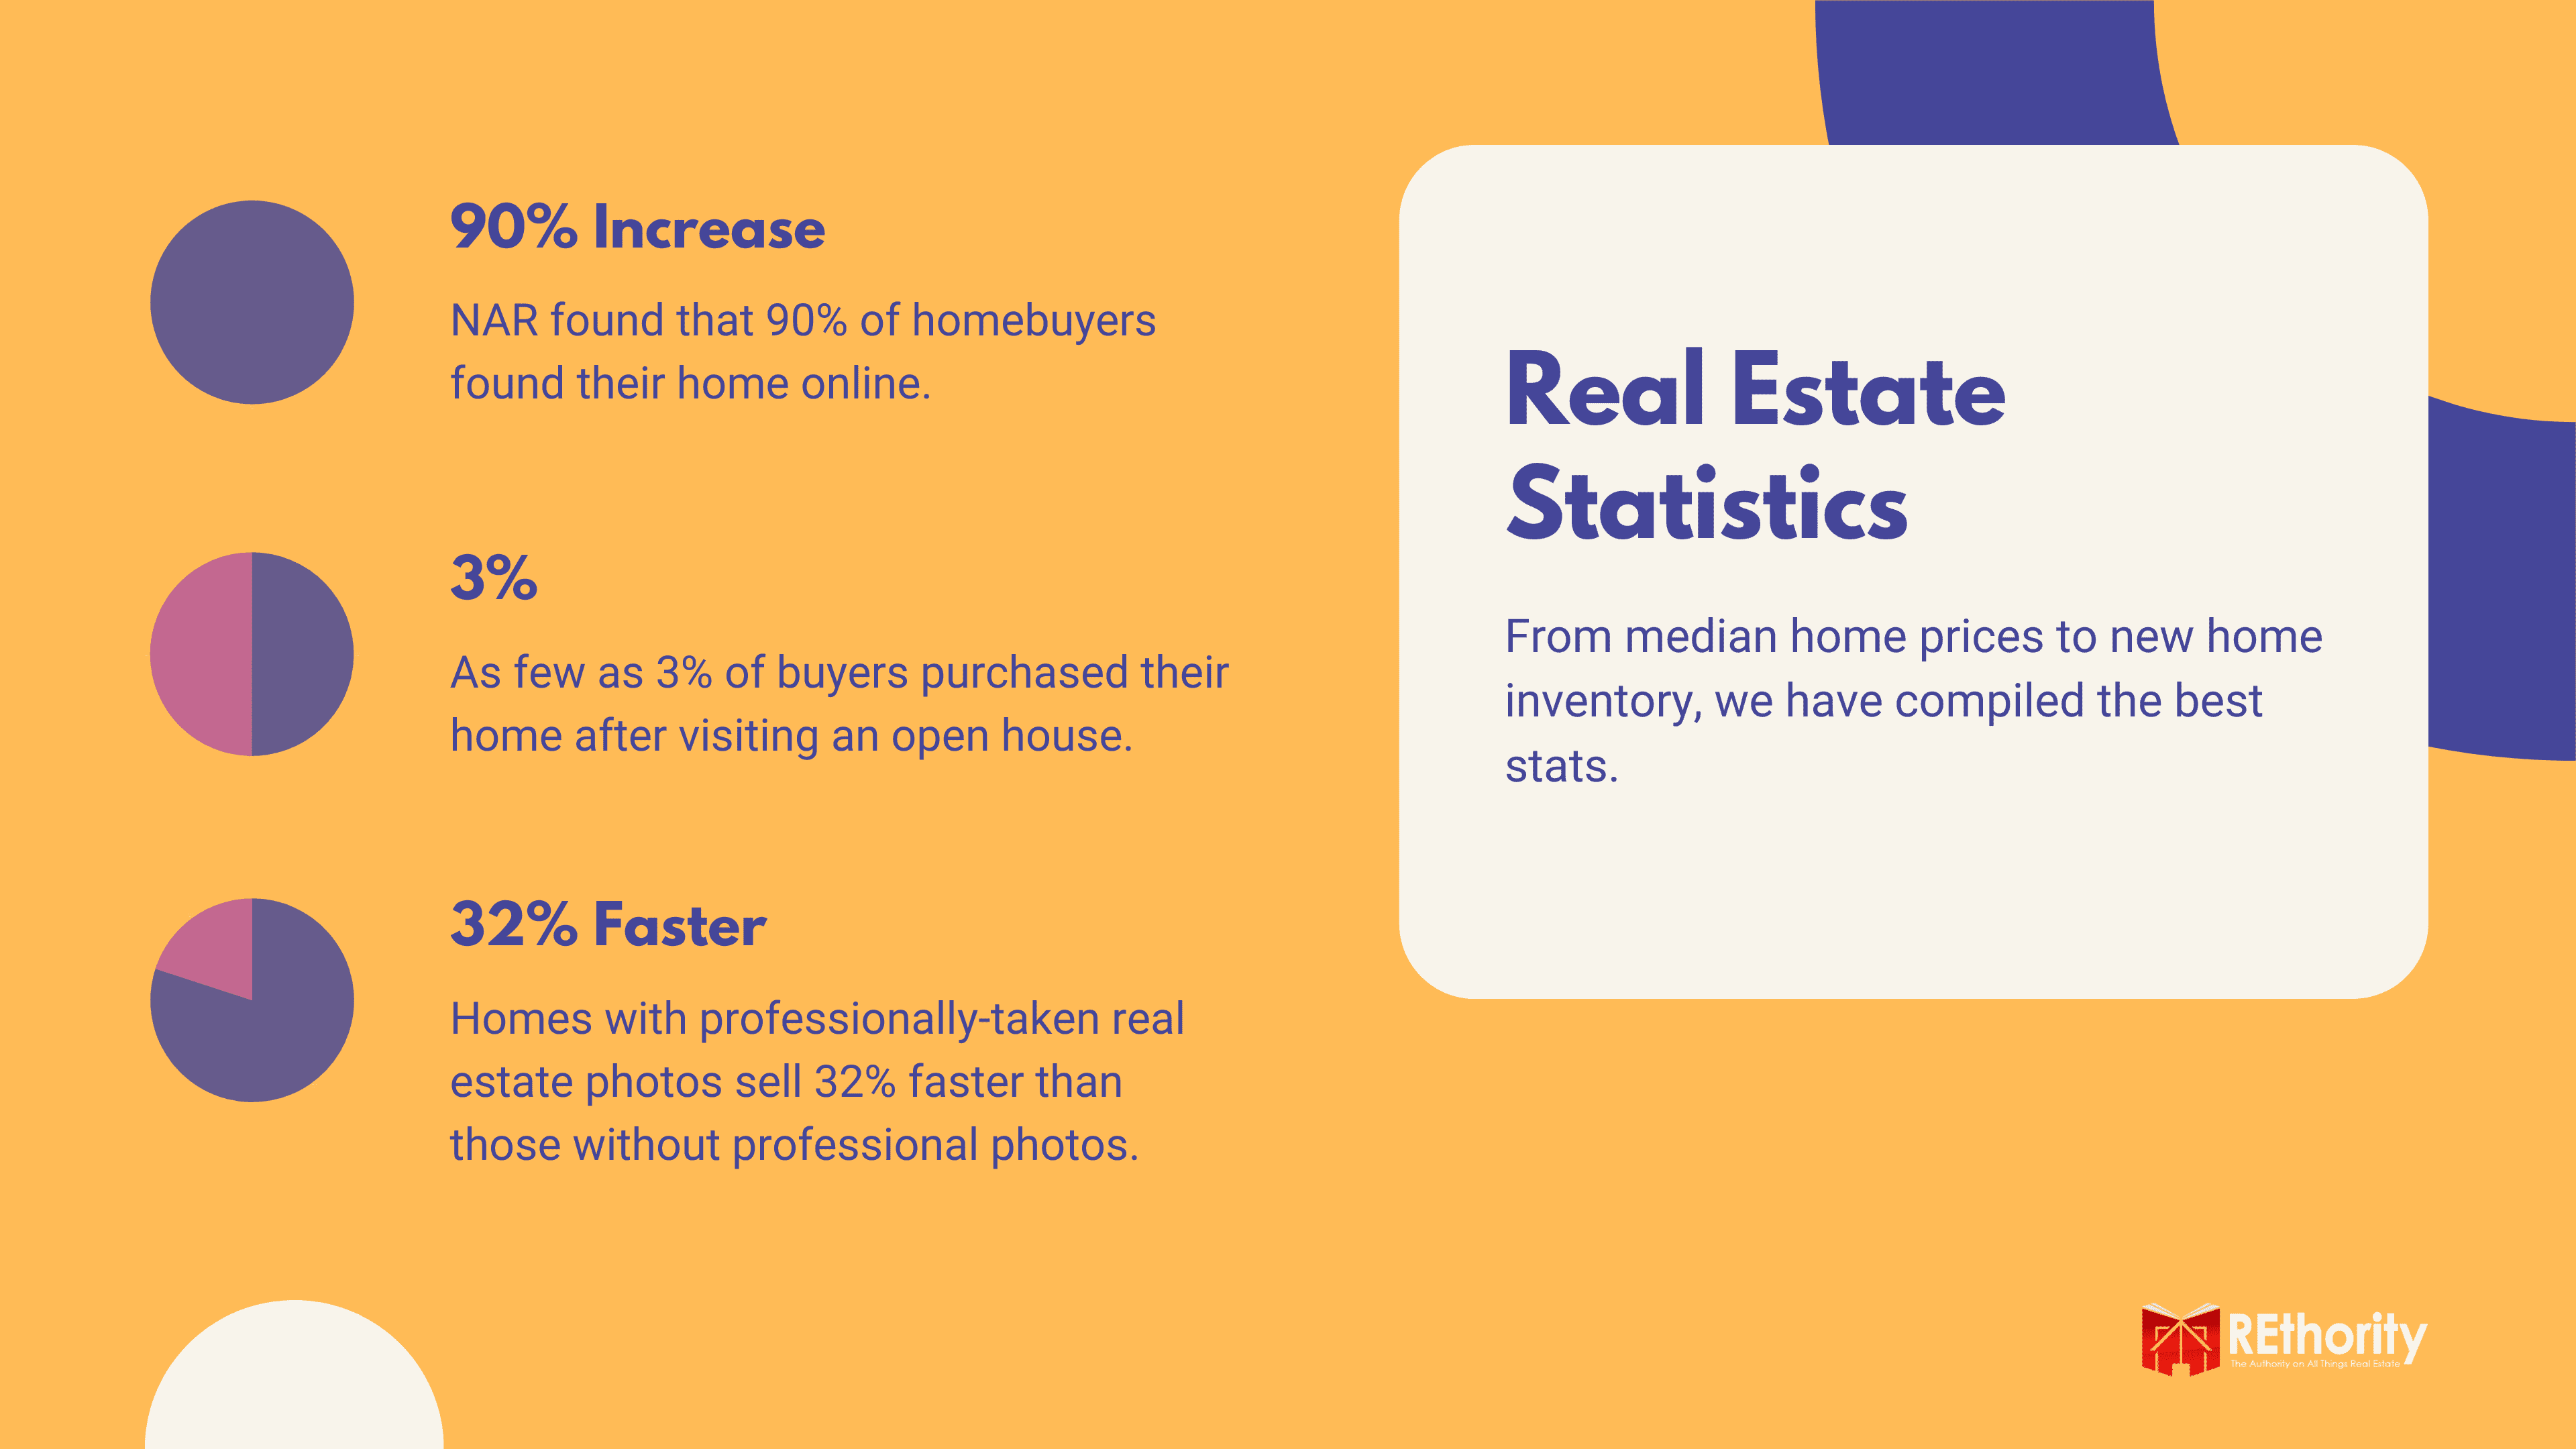
We’re in the digital age, and buyers are increasingly turning to online searches before ever talking to an agent, NAR finds. In fact, up to 90% of prospective buyers found their home using a simple Google search.
Although buyers conducted online searches, the majority still worked with an agent. Why? Even though buyers can find a home, the buying process is time-consuming and often hard to understand.
For this reason, many buyers turn to an agent for guidance. We suggest working with an agent unless you have previous real estate experience.
14. Virtual Home Tours
To capitalize on the online tour trend, companies are releasing products that allow agents to easily create online tours. Zillow now has a special app that allows buyers to take a virtual tour of homes.
While tours make viewing the property easier, some question the effectiveness of this technology on overall home sales. Regardless of this skepticism, advances in real estate technology are only getting started.
15. Declining Open House Traffic
With the rise of virtual showings, open house traffic has declined substantially. Some agents even think open houses are a waste of time.
In a study done by NAR, they concluded that as little as 3% of buyers purchase a home after visiting an open house. These are paltry numbers, but they confirm the trend toward buyer independence.
16. Real Estate Advertising Trends
Not only are open houses becoming automated, but so is real estate marketing. This trend is so prevalent that some industry watchers claim automation and email campaigns will be key advertising tools for agents in 2020.
17. Professional Photos
While automation helps agents, real estate photography still reigns supreme. So much so that houses with outstanding photos tend to sell 32% faster than those without professional photos. However, this is not necessarily the way you may think.
Between 2013 and 2017, real estate searches increased by over 200%. With this traffic increase, the potential to see a listing is much higher. While good photos make a good impression, bad photos hurt even more.
18. Drone Real Estate Statistics
Professional photos are a real estate marketing classic, but affordable drones are a relatively new entrant into the real estate market. Buyers are finding this technology novel, and the data shows it works.
In fact, homes with aerial images sold 68% faster than homes with standard images. Additionally, SoldByAir suggests that 83% of home sellers want to work with agents who use drone marketing.
While drones may not provide direct value to the home, perception is key, and the “cool factor” goes a long way in attracting new clients.
19. Real Estate Crowdfunding
High prices for real estate have caused it to be out of reach for many investors. Savvy investors realized this and sought to syndicate groups of these investors to pool money and purchase property.
Forbes reports that real estate crowdfunding has soared as an investment tool and may even become a multimillion-dollar industry. But the magazine cautions that a downturn in the economy could cause it all to come crashing down.
In fact, some bad apples have already started to rot. With large amounts of leverage and the need to show returns to their many project investors, some platforms have already seen how quickly their good intentions can turn sour.
20. 2020 Real Estate Outlook
According to Dave Ramsey, 2020’s top trend is that home prices are rising slower, with fewer offers coming in. However, U.S. News & World Report thinks 2019 will be a better time than ever to sell, at least compared to previous years.
The Oofy reaffirms this opinion and states that as long as the economy stays strong, so will the housing market. Finally, Realtor.com also believes the housing market will remain strong this year for the sole reason that mortgage rates have remained unexpectedly low.
What’s Your Favorite Real Estate Statistic?
We hope you’ve enjoyed reading our real estate statistics. While these are only the ones we found most interesting, we love your feedback.
If you find a statistic that we should include, contact us, and we’ll be sure to update our post.